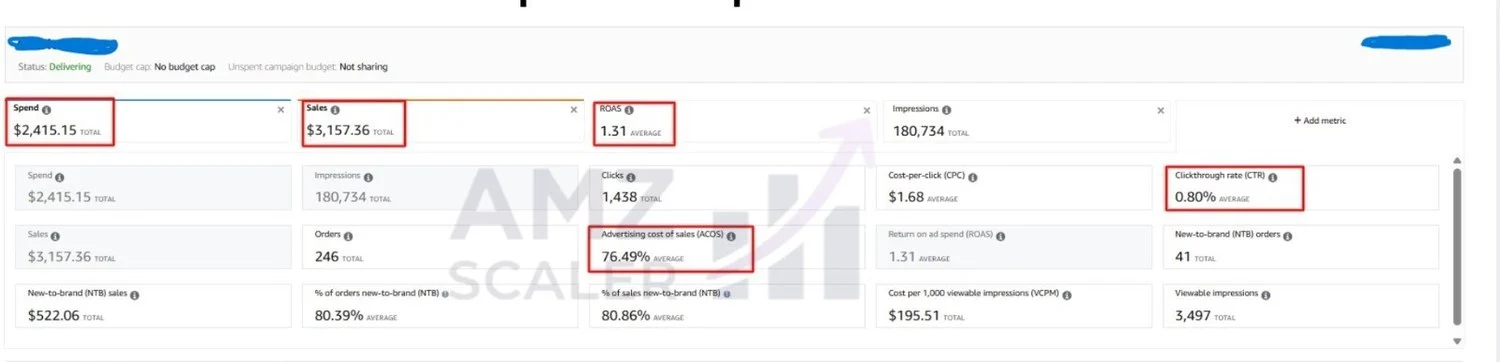
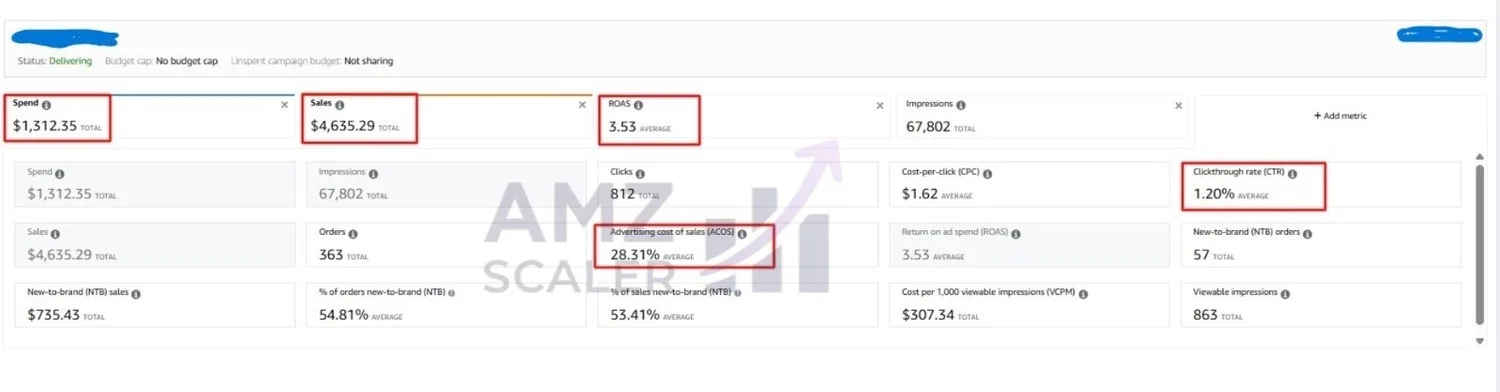
An Amazon Sponsored Ads account was spending heavily at a 76% ACoS, close to losing money on every advertised sale. Over two months we rebuilt its targeting for efficiency. ACoS fell to 28%, ad sales grew 47%, and ad spend dropped 46%. Every figure below comes directly from the account’s Amazon Ads Console.
76.49% to 28.31%
ACoS
1.31 to 3.53
ROAS
+47%
Ad sales
-46%
Ad spend
At a Glance
Situation: Steady demand, but advertising so inefficient that most sales made little or no profit
What we changed: Listing conversion first, then negatives, tighter match types, and budget moved onto proven converters
Result: ACoS 76.49% to 28.31% and sales up 47% on nearly half the spend, in two months
Account Overview
This Amazon Sponsored Ads account had steady demand that had drifted into heavy, inefficient spending. It was delivering sales, but at an advertising cost that left little to no profit once product cost and Amazon fees were counted. Client identifiers have been removed.
The Challenge
The account was running a 76.49% ACoS at a 1.31 ROAS. In plain terms it spent roughly a dollar to bring back a dollar and change, which is a losing position after cost of goods and fees. It was also spending very broadly: over 180,000 impressions in the period at a 0.80% click through rate, so most of the budget was buying visibility in front of shoppers who were not a strong match for the product. The task was to bring ACoS down to a healthy, profitable level without losing the sales the account was already making.
What We Did
Started with the listing, not the ads
Before touching the campaigns, we compared the product’s conversion rate against the category. It was lagging, so we optimized the listing first and made sure every relevant keyword appeared in the copy, since ads cannot rank a term the listing does not support. That groundwork improved conversion before a single bid changed.
Diagnosed before touching bids
We started with the search term and placement reports rather than the bid sliders, to separate the terms that were converting from the ones quietly draining the daily budget. On an account spending this inefficiently, the waste is almost always concentrated in part of the targeting, and finding it first is what makes every later change safe.
Cut the wasted reach
We added negative keywords against the non converting search terms and pruned the loose targeting that generated impressions but not orders. That is why impressions fell from 180,734 to 67,802. The drop was deliberate: we were cutting the spend that reached the wrong people.
Concentrated spend on proven converters
With the waste removed, we moved budget onto the keywords, products, and placements already producing orders, and set bids by performance rather than spreading them evenly. This is where the efficiency gain came from.
Tightened match types and bids
Proven high intent search terms moved into tighter match types, so the account paid for intent rather than chance. Bids and placements were disciplined to bring cost per click and cost per order under control.
Lifted conversion, not just clicks
Because the traffic that remained was higher intent, a far bigger share of clicks turned into orders. Conversion on ad clicks rose from about 17% to 45%, which let sales grow even as total clicks fell.
Results
Over two months the account went from a 76.49% ACoS to 28.31%, and ROAS climbed from 1.31 to 3.53. This was not achieved by spending less and accepting fewer sales. Ad sales grew from $3,157 to $4,635, orders rose from 246 to 363, and ad spend fell from $2,415 to $1,312. Click through rate improved from 0.80% to 1.20%, a direct sign the ads were now reaching the right shoppers.
Metric
Before
After
Change
Ad spend
$2,415.15
$1,312.35
-46%
Ad sales
$3,157.36
$4,635.29
+47%
ACoS
76.49%
28.31%
-48.2 pts
ROAS
1.31
3.53
+2.7x
Orders
246
363
+48%
Conversion rate
17.1%
44.7%
+27.6 pts
Impressions
180,734
67,802
-62%
Click through rate
0.80%
1.20%
+0.40 pts
Cost per click
$1.68
$1.62
-4%
Figures from Amazon Campaign Manager, ad-attributed. Client identifiers removed.
Before: The Starting Point
Spend of $2,415.15 returned $3,157.36 in ad sales at a 1.31 ROAS and a 76.49% ACoS, on 180,734 impressions at a 0.80% click through rate. High spend, broad reach, thin return.
Before: 76.49% ACoS on $2,415 of spend. Source: Amazon Campaign Manager, client identifiers removed.
After: Two Months Later
The same account after the rebuild. Spend of $1,312.35 returned $4,635.29 at a 3.53 ROAS and a 28.31% ACoS, on 67,802 tightly targeted impressions at a 1.20% click through rate.
After: 28.31% ACoS and $4,635 in ad sales on $1,312 of spend.
Why This Worked
Efficiency came from subtraction before addition. The account did not need more spend, it needed the wrong spend removed. Cutting the low intent reach first meant every remaining dollar worked against search terms that converted, which pulled ACoS down while sales went up.
Tighter targeting compounds. As click through rate rose from 0.80% to 1.20%, the ads read as more relevant, which supports better placement and lower cost over time. The gain is a structure that keeps paying off, not a one time cut.
Final Takeaway
A high ACoS is rarely a spending problem. It is a targeting problem wearing a spending costume. This account went from a 76% ACoS to 28% in two months, with sales up 47% on nearly half the ad spend, by finding the waste, removing it, and concentrating budget on what was proven to convert. Results depend on each account’s competition, pricing, reviews, and inventory.
If your ACoS looks like the starting point here, our guide on how to lower ACoS covers the same levers, and our Amazon PPC management service applies them to your account. See more outcomes on our client results page.
Want the full case study as a PDF? It includes every figure and the Ads Console screenshots, ready to share with your team.
Amazon advertising and listing specialists with 5+ years managing PPC and listing optimization for brands across the US, UK, and Canada. We publish what we apply in real seller accounts every day.