Is a $1.40 click expensive? Is a 12% conversion rate good? Sellers ask for Amazon PPC benchmarks because they want to know whether their numbers are normal. Benchmarks help, but only if you read them correctly. Averages hide huge differences by category, price point, and product maturity. This guide gives you the directional 2026 ranges, explains what drives them, and shows how to build the benchmarks that actually matter: your own.
Quick Answer
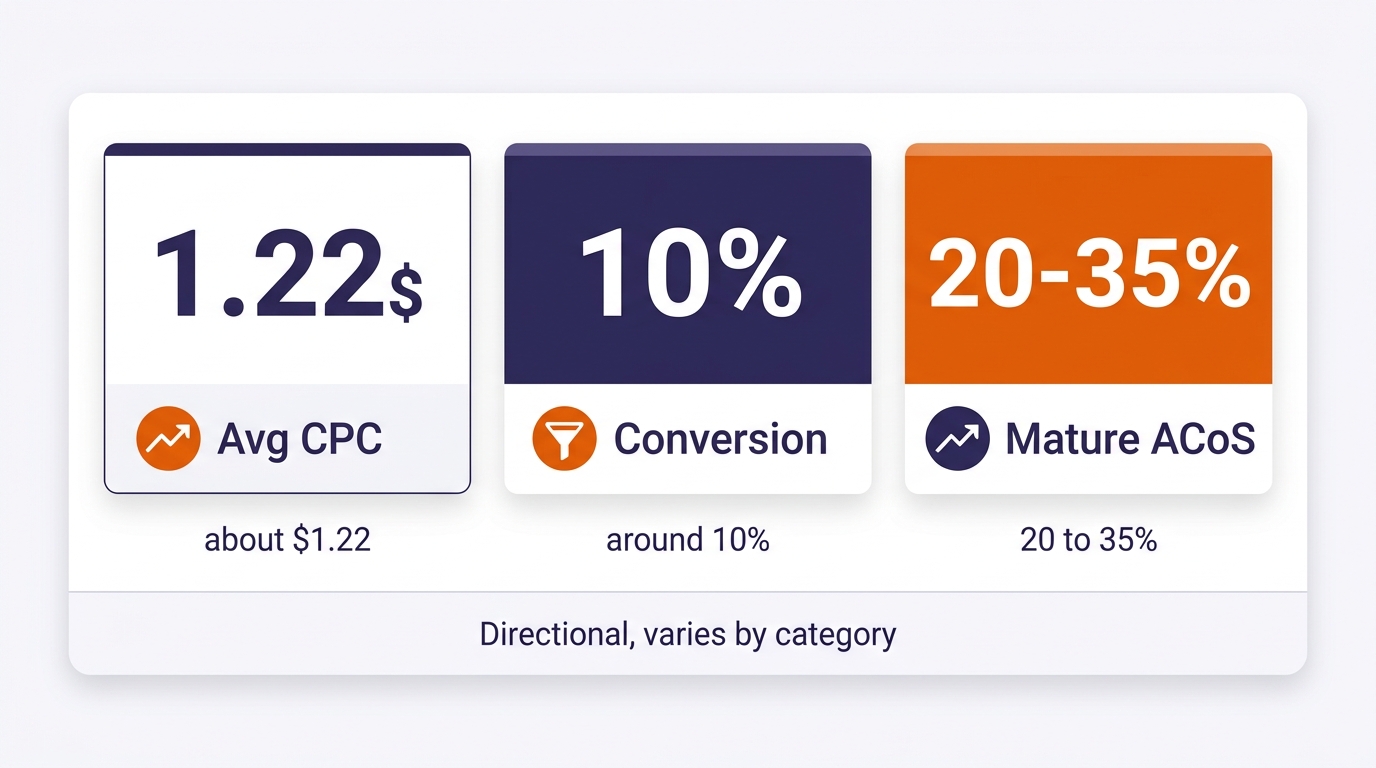
Industry trackers put the average Amazon Sponsored Products cost per click at around $1.22 in 2026, roughly $0.10 higher than the year before, with conversion rates commonly around 10% and mature campaigns often running an ACoS between 20% and 35%. Treat these as directional only. Category, price, and competition change them dramatically, and the only benchmark that tells you whether you are profitable is your own break-even ACoS.
IMPORTANT: The figures in this article come from third-party trackers and industry reporting, not from Amazon. They are directional, vary by category and marketplace, and change month to month. Use them for context, not as targets.
Key Takeaways
Average Sponsored Products CPC sits around $1.22 in 2026 (directional).
CPCs peak around big shopping periods and dip in quieter months.
Conversion rates vary hugely by category and price.
Your break-even ACoS matters more than any industry average.
Track your own numbers monthly to build real benchmarks.
Category competition, season, match type, placement
Year-over-year CPC change
Roughly +$0.10 versus 2025
More advertisers, AI placements, event periods
Conversion rate
Commonly around 10%
Price, reviews, listing quality, relevance
ACoS, mature campaigns
Often 20% to 35%
Margin, competition, brand strength
ACoS, launch phase
Often 30% to 50%
Deliberate investment in rank and data
Ad Badger’s tracker, for example, reported the 2026 average CPC at about $1.22, with a low near $1.02 in October 2025 and a high near $1.32 in June 2026, around Prime Day. That pattern is typical: costs rise around big events and fall in quieter months.
Directional 2026 ranges. Your category and price point will move every one of these numbers.
What Makes Your Numbers Differ
Category. Supplements, electronics, and beauty often see far higher CPCs than niche home or hobby products.
Price. A $60 product can afford a higher CPC than a $12 product at the same ACoS. That is why CPC alone never tells you if you are overpaying.
Product maturity. New products with few reviews convert lower and usually run a higher ACoS while building rank.
Match type and placement. Exact match and top of search usually cost more and convert better than broad and product pages. See bid strategies and placement adjustments.
Brand terms. Branded keywords usually convert far better and cost less, which can flatter your overall averages.
Build Your Own Benchmarks (the Ones That Matter)
An industry average cannot tell you whether a campaign makes money. Your own numbers can. Start with your break-even ACoS for each product: your margin before ads. If you keep 40% after COGS and fees, a 38% ACoS is barely profitable, even though it looks “average.” Our guide to what a good ACoS is walks through it, and TACoS shows whether ads are growing total sales or just renting them.
Record CPC, conversion rate, ACoS, and TACoS per product every month.
Compare each month against the same month last year, not just last month.
Note events, price changes, and listing changes so you can explain the swings.
Use the PPC audit checklist quarterly to check the account against your own targets.
TIP: The most useful benchmark comparison is your product against the three competitors beside it in search results, not against an industry average. Their price, reviews, and images set the conversion rate you are competing against.
What Changed in 2026
Costs crept up, and new placements arrived. Sponsored Products now also serve inside Amazon’s AI assistant and in creator content off Amazon, both of which can shift averages as they grow. The FTC’s lawsuit over ad pricing also put a spotlight on how auction prices are set, which is another reason to anchor bids to your own margins.
When Not to Compare Against Benchmarks
Do not judge a launch against mature-product averages, and do not compare a $15 product against a category average dominated by $80 items. And never cut a profitable campaign because its ACoS is higher than some published average. If it is below your break-even and growing total sales, it is doing its job.
COMMON MISTAKE: Chasing a benchmark ACoS instead of profit. Pushing ACoS down to match an average usually means cutting spend on keywords that were profitable, which lowers total sales and organic rank.
If you want your numbers read against your real margins, that is how our PPC management starts. See the outcomes on our client results page.
What is the average Amazon PPC cost per click in 2026?
Third-party trackers put the average Sponsored Products CPC at around $1.22 in 2026, roughly $0.10 higher than 2025. Treat this as directional; your category and price point can put you well above or below it.
What is a good conversion rate for Amazon PPC?
Many sellers see around 10% on Sponsored Products, but it varies widely by category, price, and reviews. Compare against your own history and your direct competitors rather than a single average.
What is a good ACoS benchmark?
Mature campaigns often run between 20% and 35%, and launches often run 30% to 50%. The right number for you is below your break-even ACoS, which is your margin before ad costs.
Why are Amazon CPCs rising?
More advertisers competing, peak shopping events, and new placements all push costs up. Costs typically rise around Prime Day and Q4 and ease in quieter months.
Should I lower bids if my CPC is above average?
Not automatically. A higher CPC can be profitable if your price and conversion rate support it. Set bids from your own break-even math, not from the average.
Written by the AMZ Scaler Team
Amazon advertising and listing specialists with 5+ years managing PPC and listing optimization for brands across the US, UK, and Canada. We publish what we apply in real seller accounts every day.
We compare your campaigns against your break-even, not an industry average, and show you where you’re overpaying and where you’re leaving growth behind.